Radiative Feedbacks and Climate Sensitivity
Overview: We explore how climate sensitivity varies with different patterns of radiative forcing using a coupled ocean-atmosphere model.
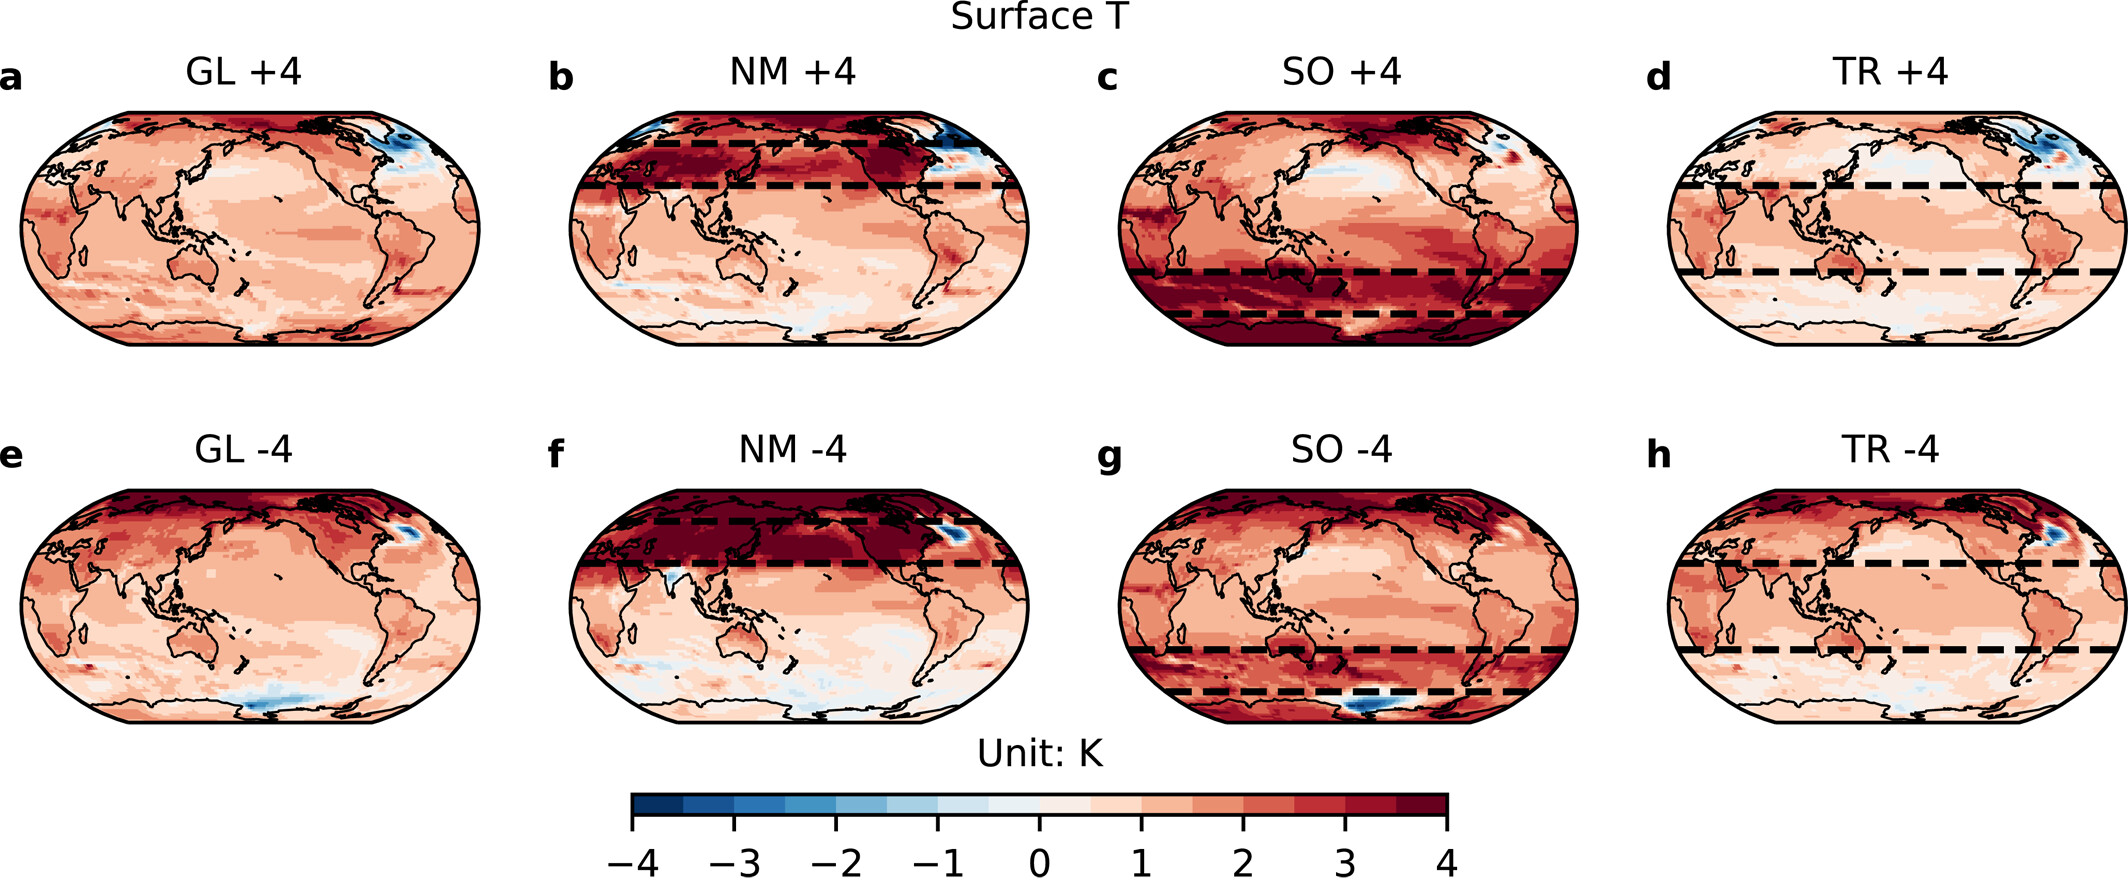
Maps of surface temperature changes (i.e., sea surface temperature over ocean and surface skin temperature over land; units: K) averaged over the last 50 years (year 151–200) of each simulation relative to the base state of Control. The dashed lines in NM, SO, and TR mark the geographical boundaries of the anomalous solar forcing imposed. The negative of the surface temperature responses are shown for the negative forcing experiments (e–h).
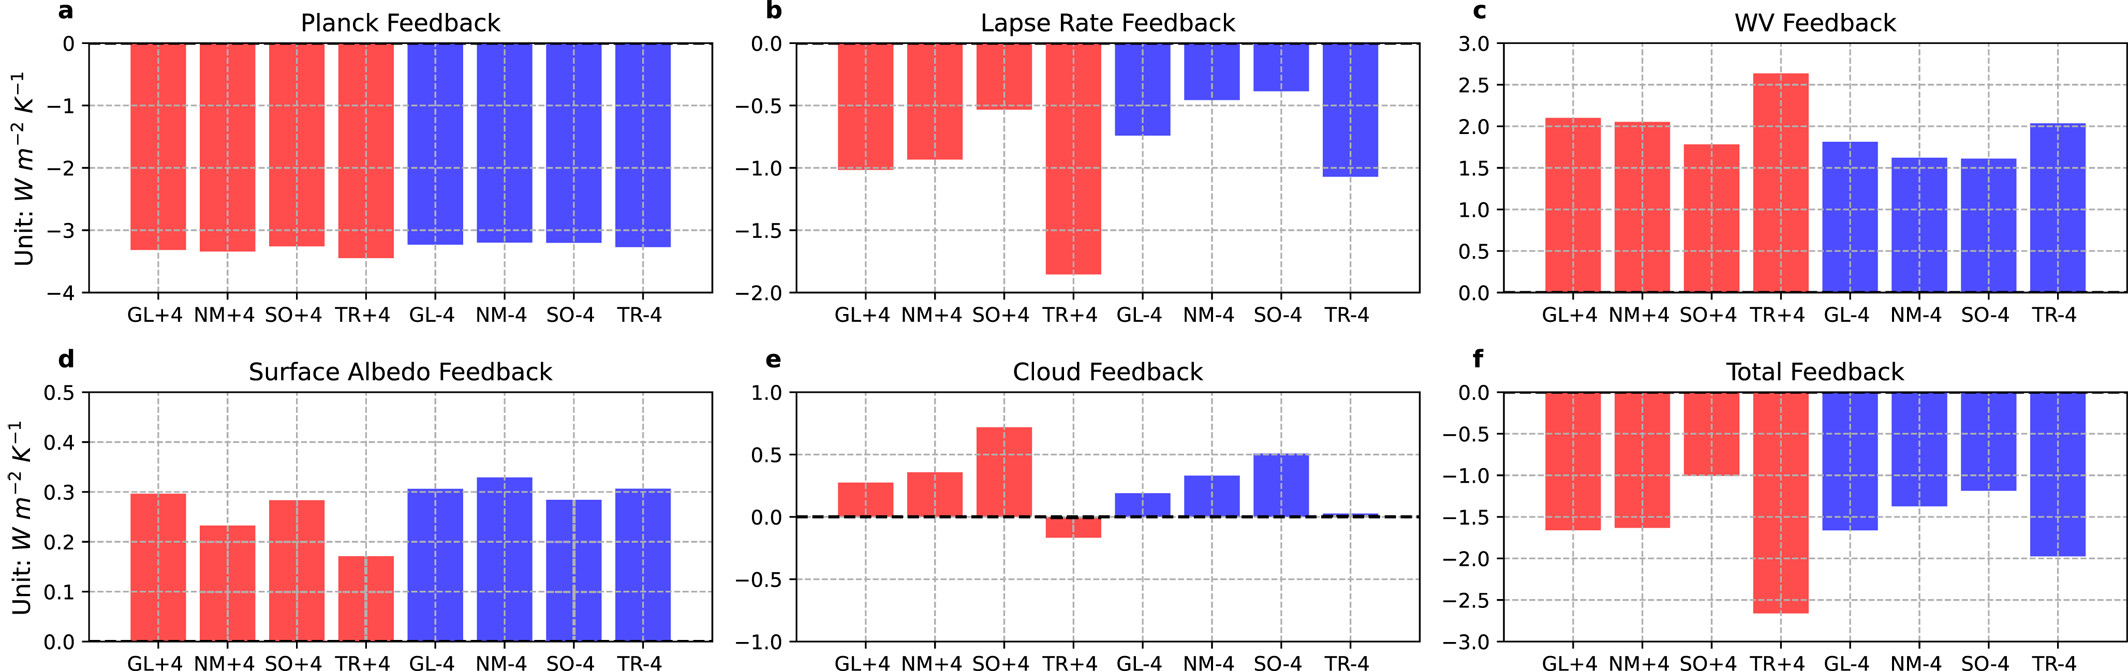
Individual feebacksFigure 2
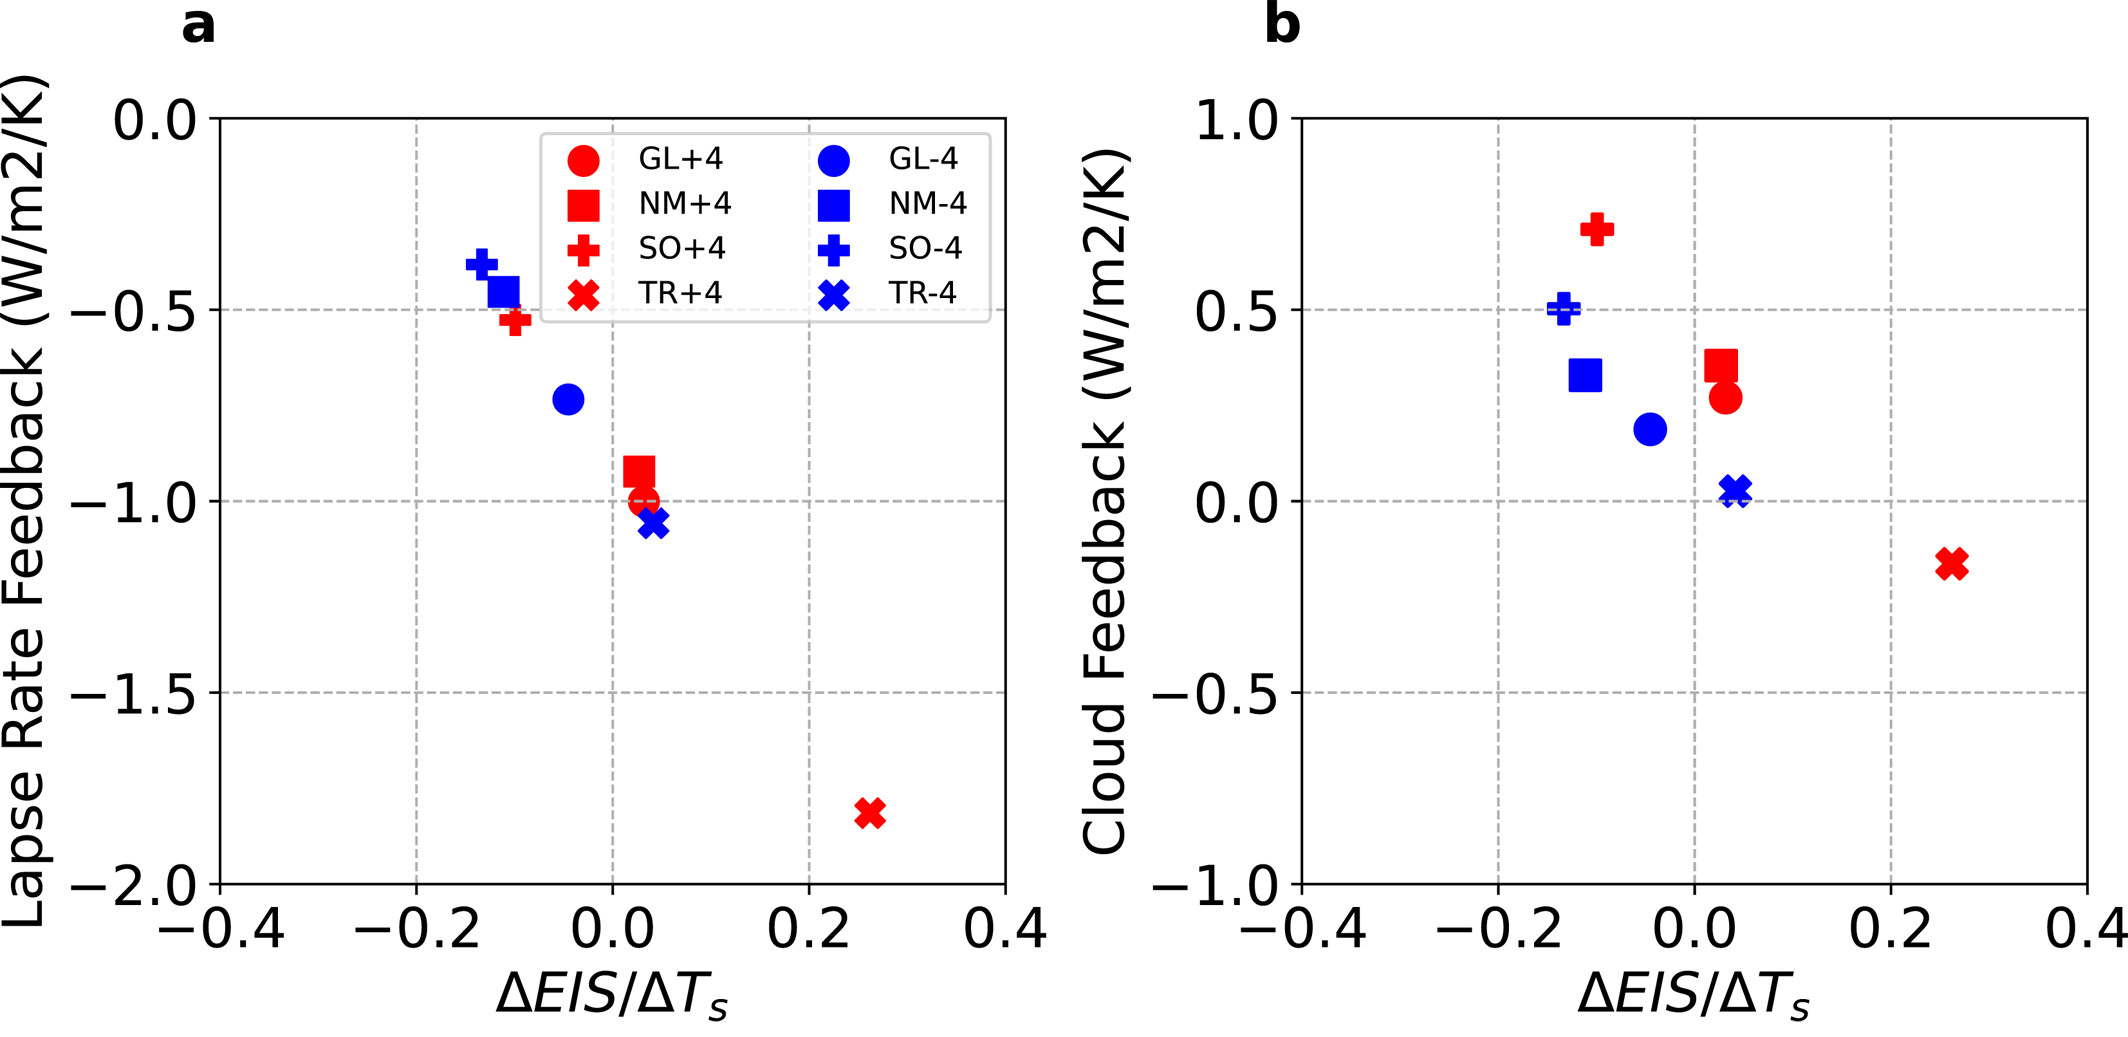
Scatter plots