Overview: Potential intensity varies widely across GCMs even under the same SSTs, and we find that this spread is largely caused by differences in tropopause and lower-stratospheric temperatures. Idealized experiments with modified upper-atmospheric temperature profiles show strong sensitivity of TC activity: global TC frequency and ACE shift by roughly 35%, and hurricane frequency by nearly 80%, with smaller but notable effects on lifetime maximum intensity. These results point to an overlooked influence of upper-atmospheric temperature biases on simulated TC behavior and emphasize that future TC changes may depend strongly on how the upper atmosphere responds to anthropogenic forcing.
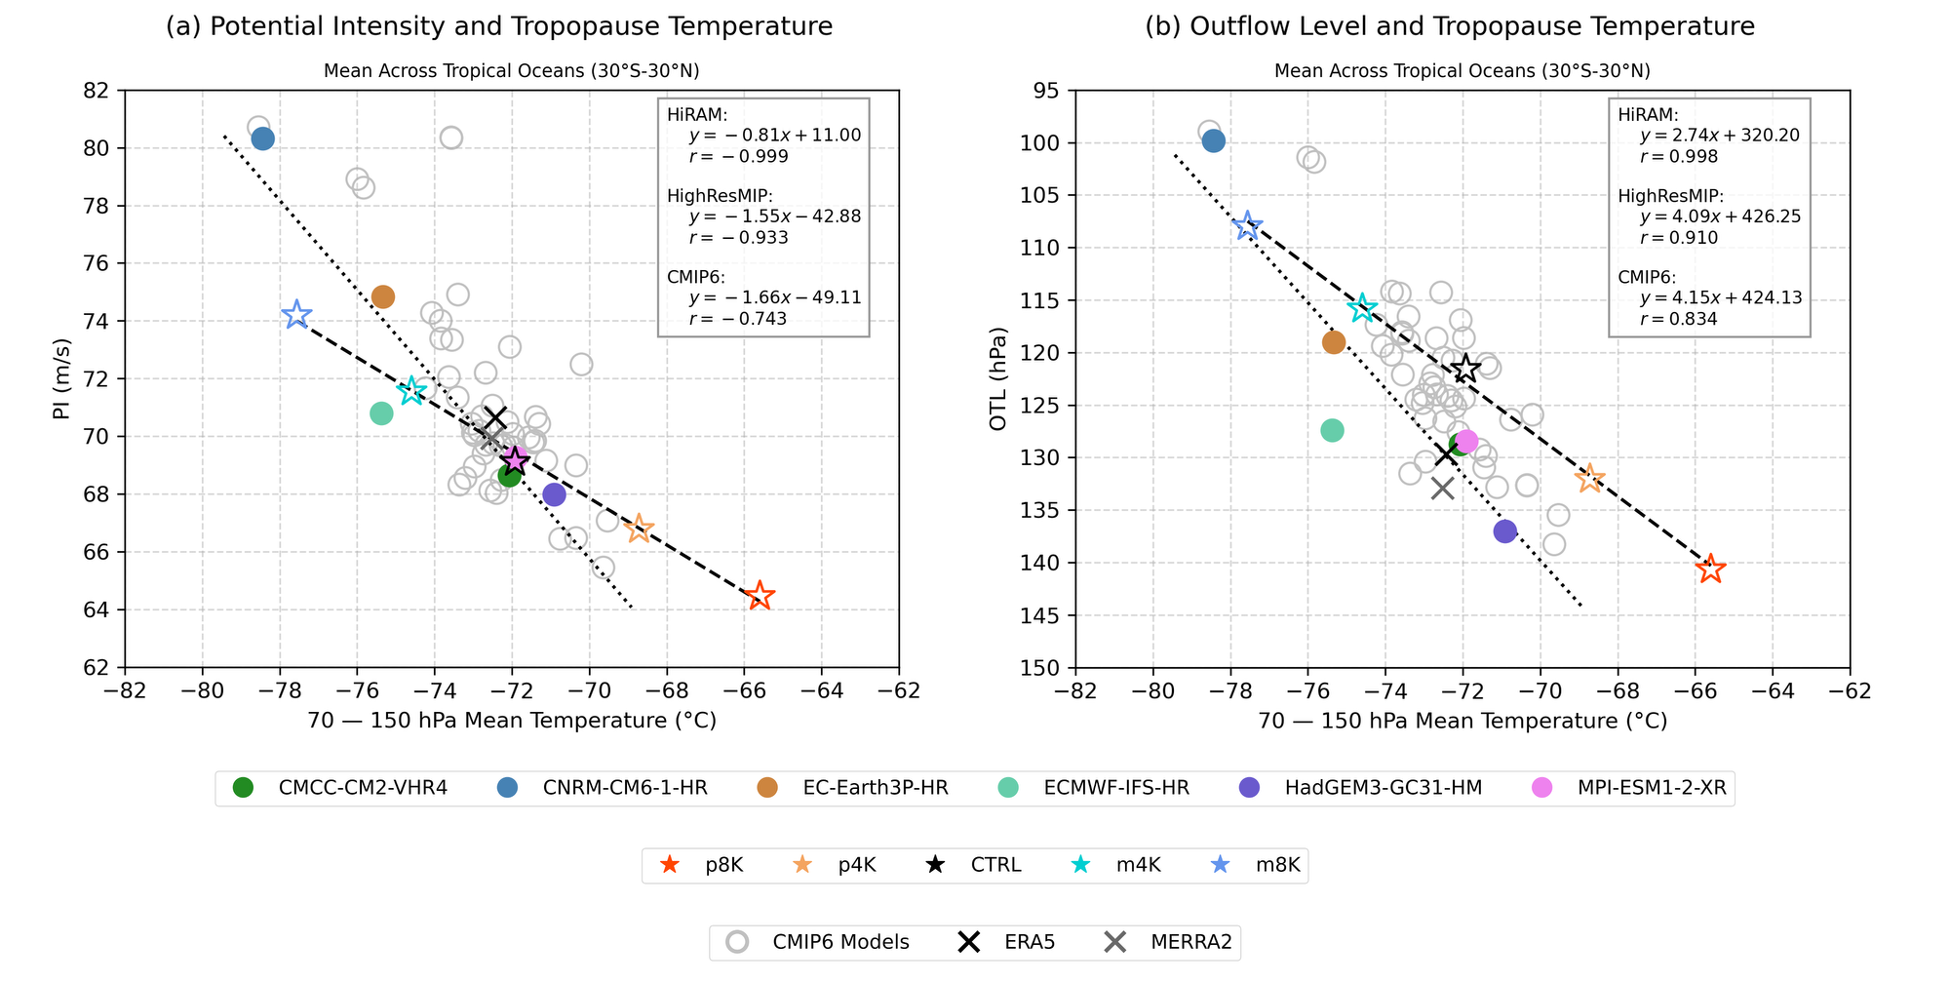
Tropical mean (a) potential intensity (PI) and (b) outflow level (OTL) compared to the 70-150 hPa layer mean temperature over the open oceans. HighResMIP simulations are solid-colored circles. HiRAM simulations are indicated by stars. The 47 CMIP6 models are gray open circles. Reanalysis data are marked with an X. Linear regression lines are plotted for HiRAM (dashed) and HighResMIP (dotted).
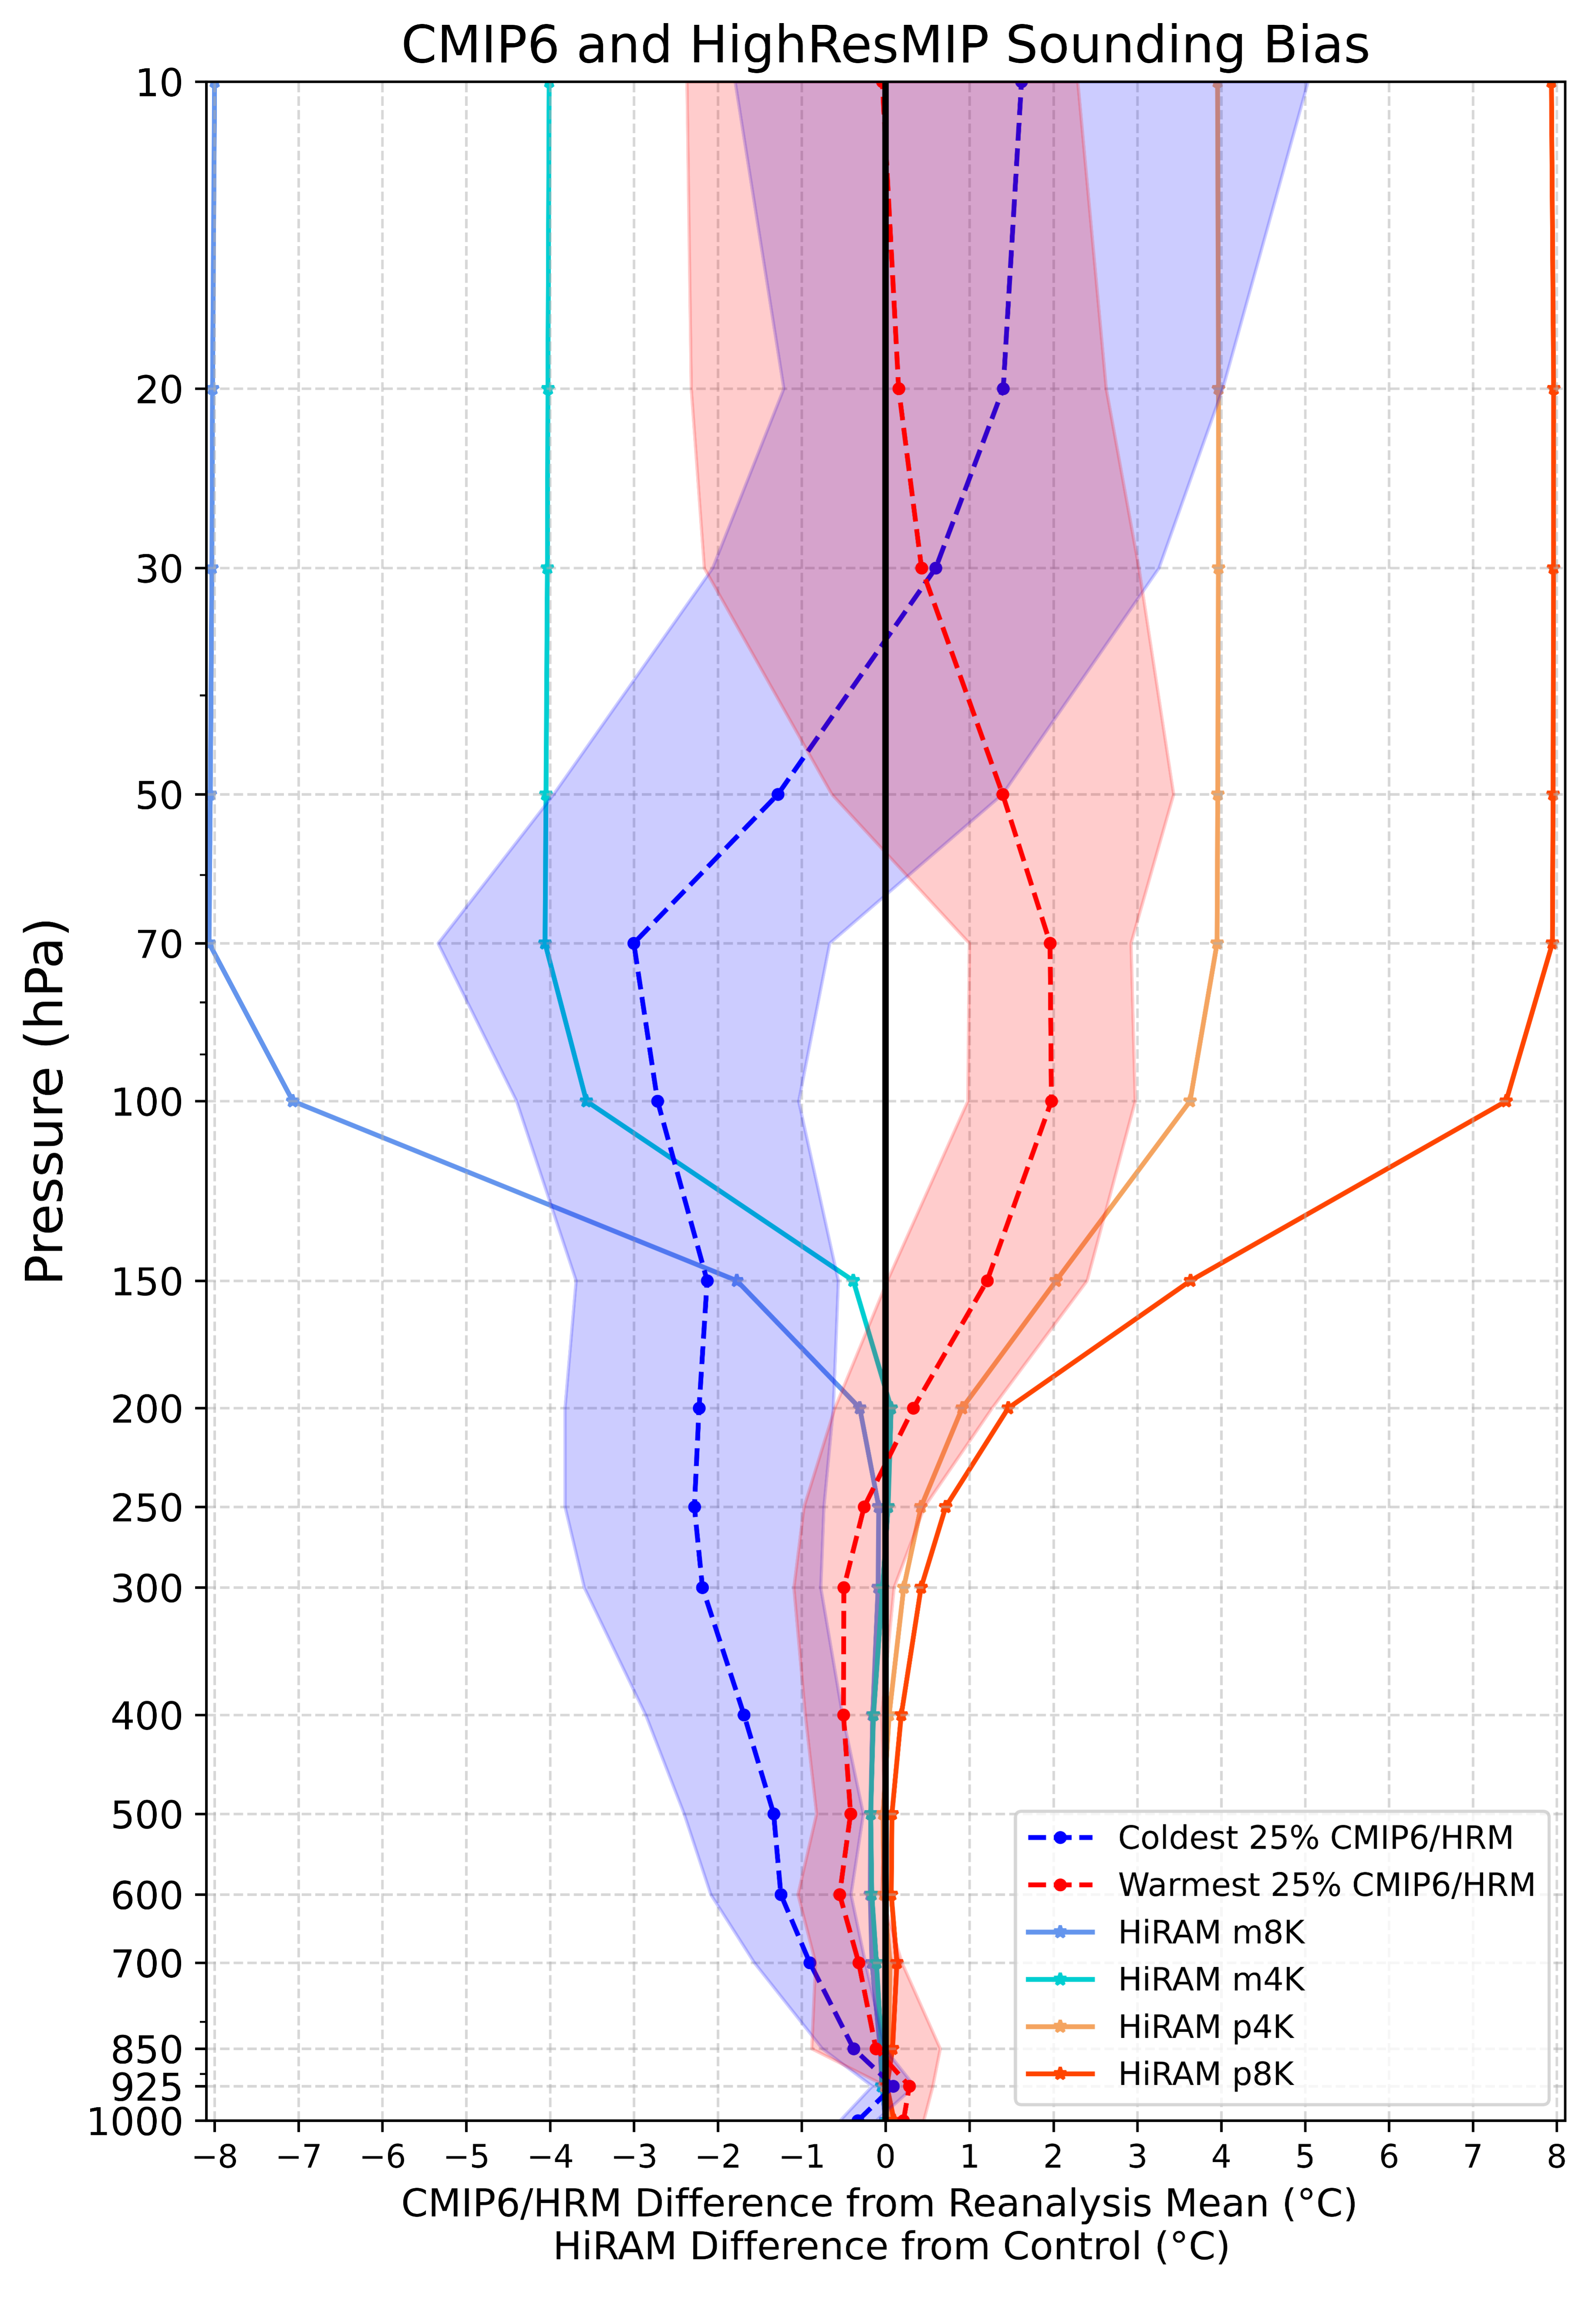
Difference of the coldest 25% and warmest 25% CMIP6 and HighResMIP (HRM) temperature profiles from the mean of MERRA2 and ERA5 reanalysis, where coldest and warmest are determined by 70-150 hPa layer mean temperature. HiRAM simulations with modified upper atmospheric temperature profiles are shown as a difference from the HiRAM control simulation.
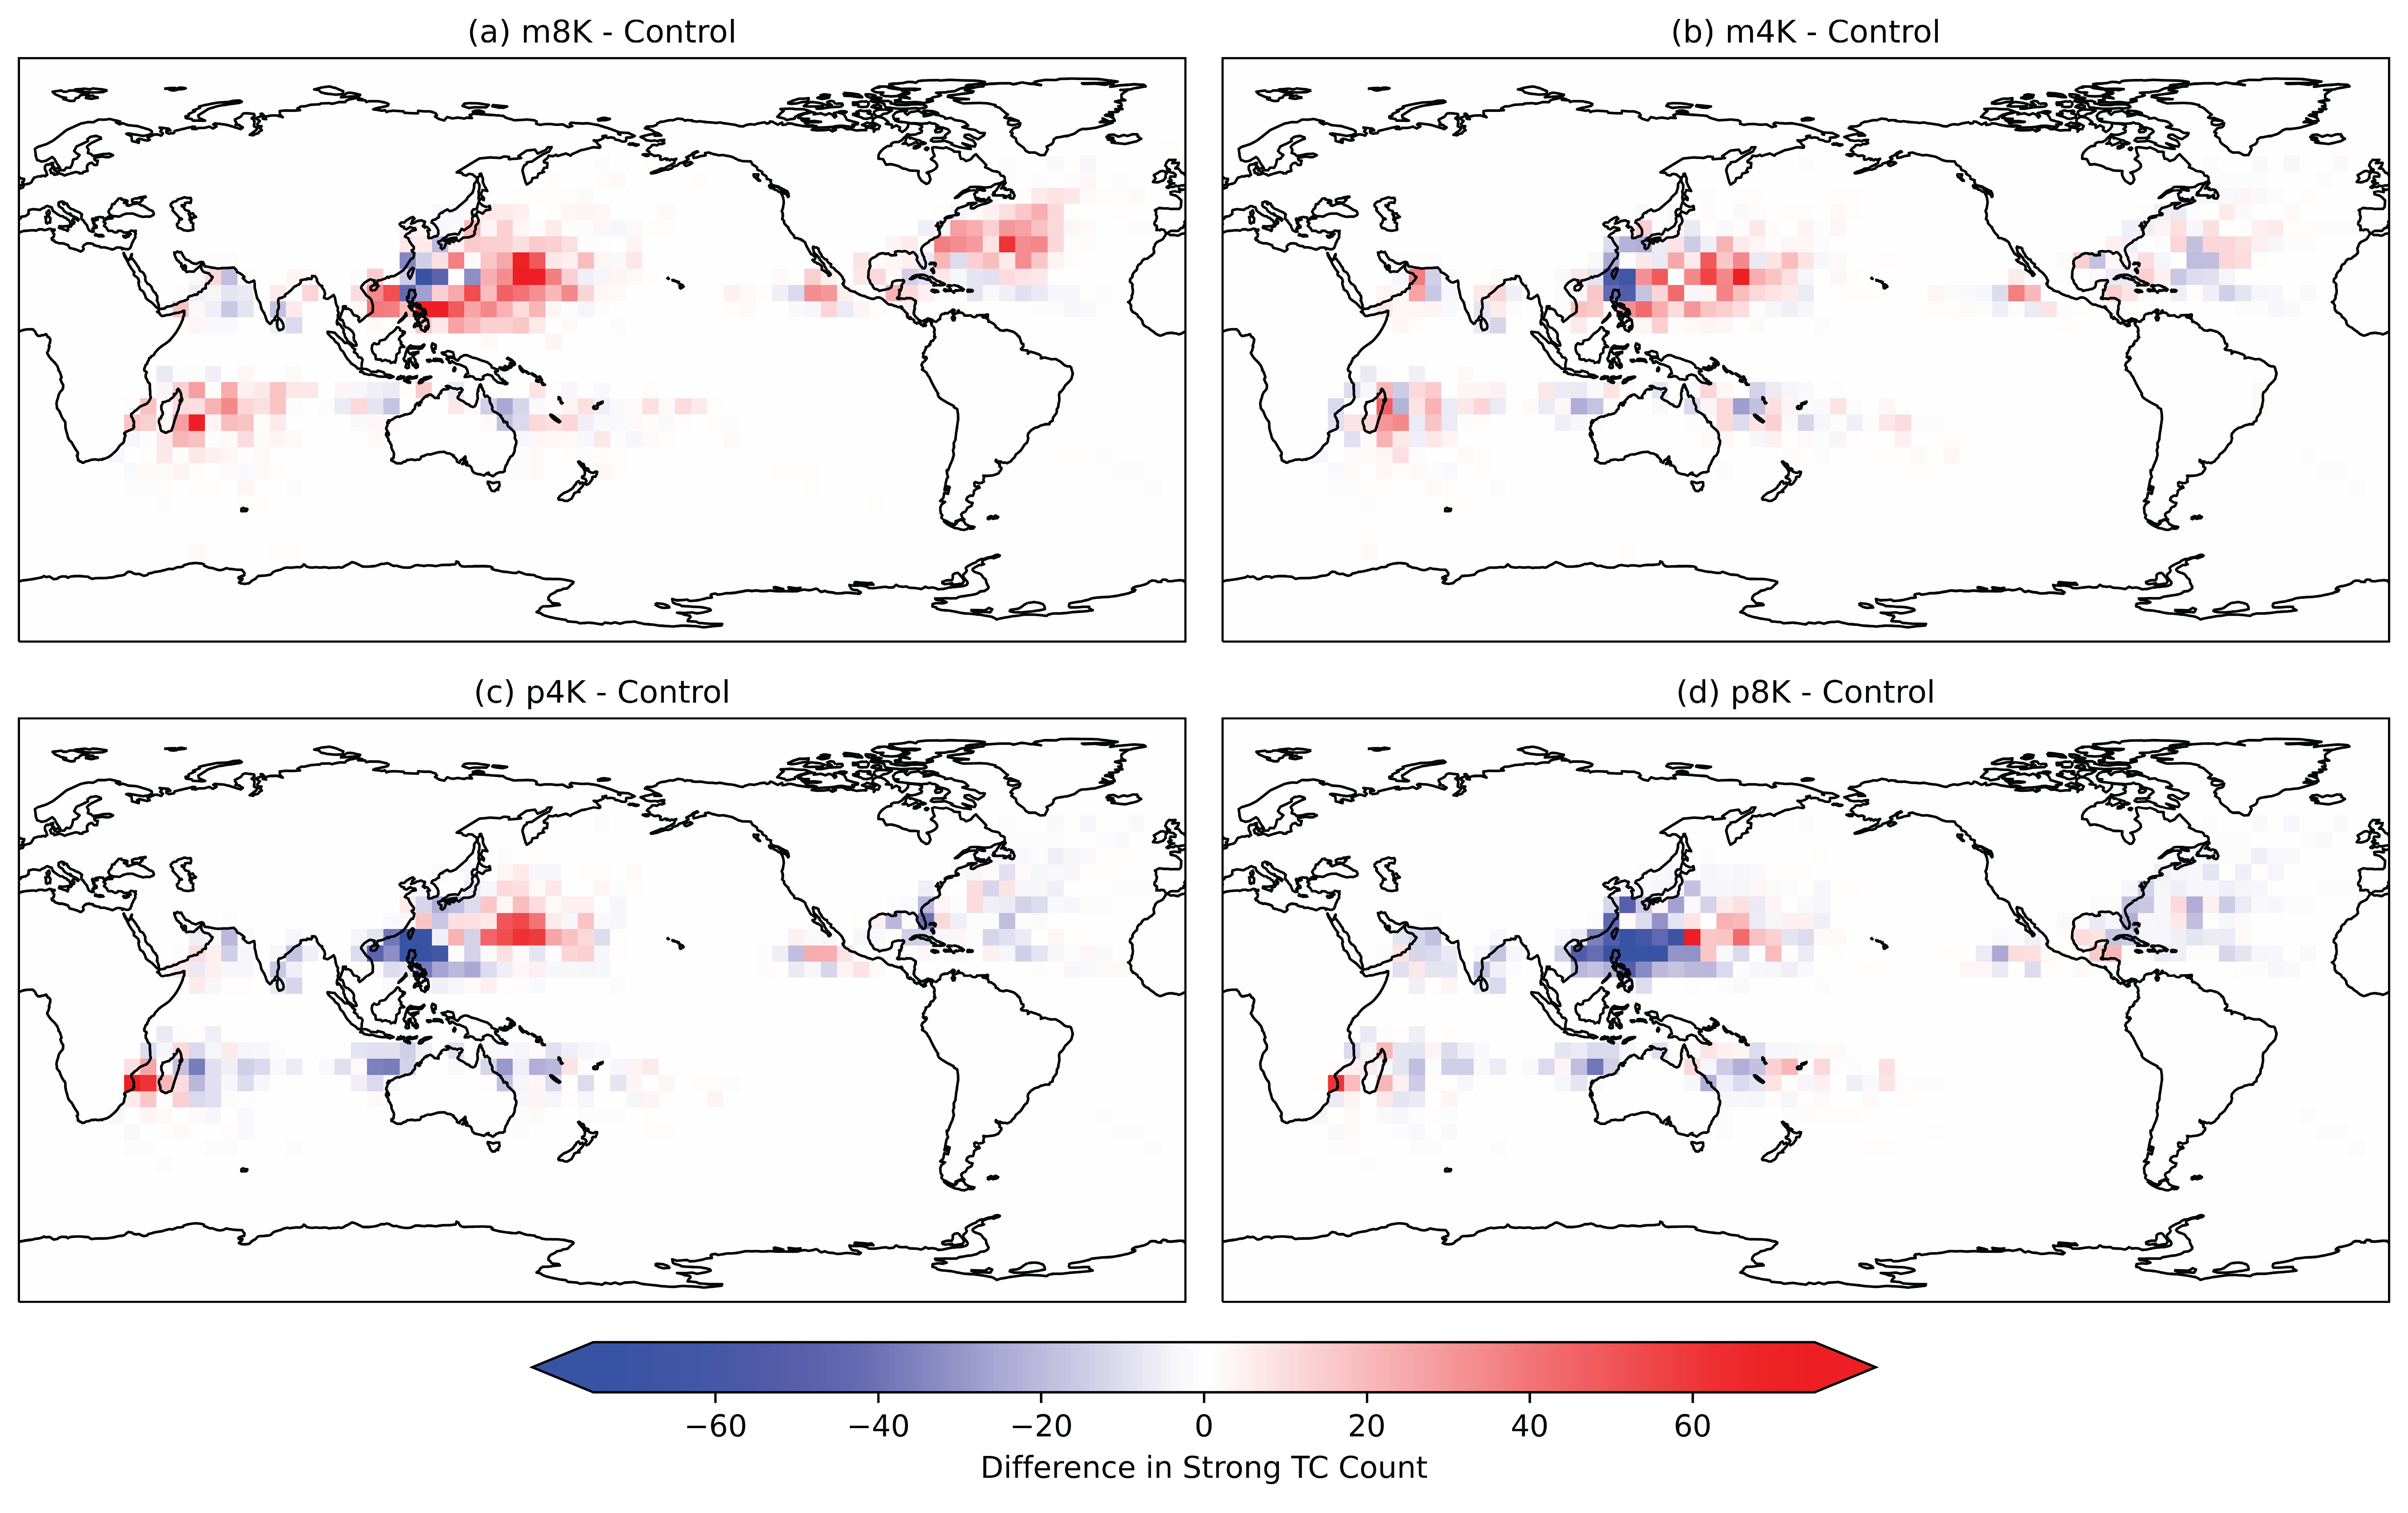
Change in strong TC track density relative to the HiRAM control simulation for a) m8K, b) m4K, c) p4K, and d) p8K. Track density is the total number of TC tracks in each 5° x 5° latitude/longitude bin.